
Revenue Cycle Management Fractures That Cost Healthcare Practices
Thousands Each Month
A practical breakdown of where claims processing, billing workflows, and payer interactions break down — and how healthcare practices restore financial performance.
The Operational Problem
Revenue cycle management failures rarely occur in a single place. Instead, revenue loss happens through multiple small operational breakdowns that compound over time — creating significant financial drag on healthcare practices.
Most practice owners assume their billing problems are isolated. The reality is that RCM inefficiencies create cascading effects across the entire revenue capture process.
Key Insight
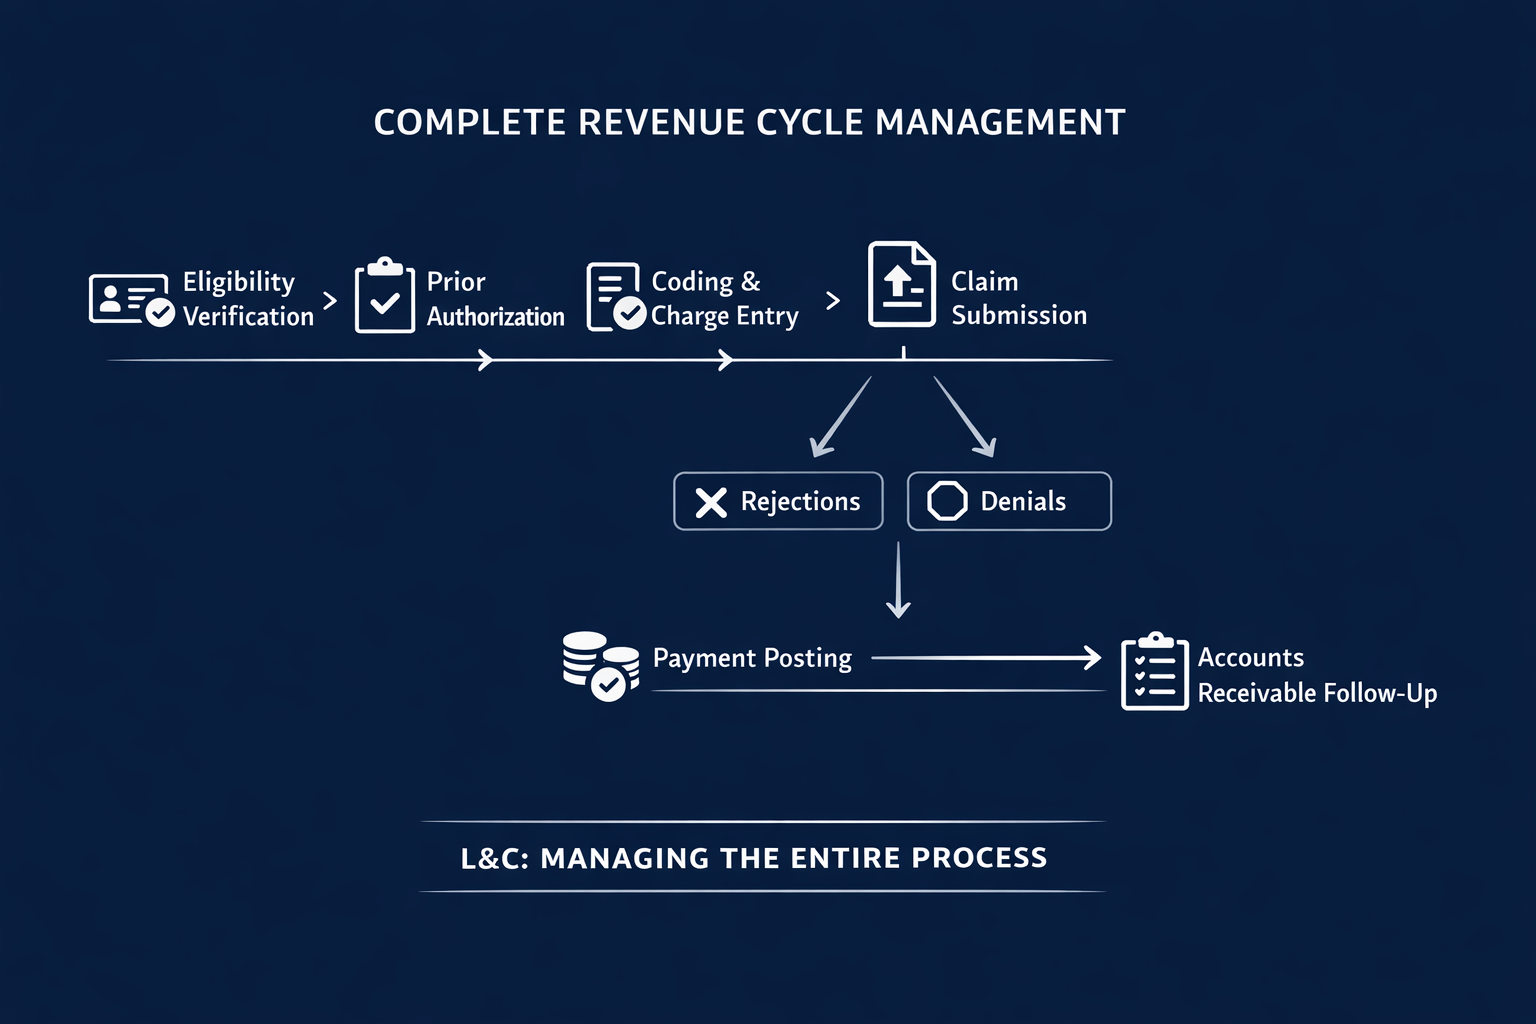
A single eligibility verification error can trigger a chain reaction: claim rejection, delayed resubmission, extended A/R days, and ultimately, revenue that may never be recovered.
Common Breakdown Points
Eligibility & Benefit Verification
Incorrect benefit verification causes claim denials.
Prior Authorization Failures
Missing or wrong authorizations lead to avoidable denials.
Claim Submission Errors
Claim construction errors cause immediate rejections and delays.
Claim Rejections & Denial Management
Claims can be rejected before review or denied after adjudication, and without tracking, both stall revenue.
Revenue Leakage Flow
Error
Rejection
Delay
Loss
Hidden Financial Impact
The real cost of RCM inefficiencies often goes unnoticed until it becomes a significant financial burden.
Example Revenue Impact Calculation
- Practice Metrics
Patients per month = 500
Average reimbursement = $150
Initial rejection rate = 15%
Denial rate = 15%
- Financial Impact
Monthly billing potential
$75,000
Revenue potentially delayed or lost
Annual Impact Projection
$132,000 – $204,000
Where Most Practices Struggle
Eligibility & Benefit Verification
- Incorrect benefit verification creates downstream denials. When patient coverage details are not accurately captured at intake, claims are submitted to the wrong payer or with incorrect benefit information.
Common Issues
Outdated insurance information
Incorrect policy numbers
Missing secondary coverage
Benefit limits not verified
Prior Authorization Failures
- Missing or incorrect authorizations tied to CPT codes or service dates result in automatic denials that could have been prevented with proper workflow.
Common Issues
Authorization not obtained before service
Wrong CPT codes authorized
Expired authorizations
Missing documentation
Claim Submission Errors
- Technical errors in claim construction prevent clean submission and trigger immediate rejections that delay the entire revenue cycle.
Common Issues
Incorrect modifiers
NPI mismatches
Taxonomy errors
Payer formatting issues
Claim Rejections & Denial Management
- Claims can fail at two different stages after submission. Rejections occur before claims enter payer adjudication, while denials occur after review when a claim is determined not payable. Without structured tracking and follow-up, both can quietly stall revenue.
Common Issues
Rejected claims due to clearing house errors
Denials not appealed within payer timelines
Missing or incorrect claim data
Repeat denial patterns from unresolved root causes
What High-Performing Practices Do Differently
Practices that consistently maintain strong financial performance share common operational characteristics. They invest in structured systems that prevent revenue leakage rather than simply reacting to problems after they occur.
Key Differentiator
Structured Revenue Cycle Systems
Eligibility Verification Workflows
Systematic verification of patient coverage before every encounter, with real-time payer connectivity.
Prior Authorization Tracking
Centralized tracking of all authorization requests with automated alerts for expirations and renewals.
Claim Submission Quality Control
Pre-submission validation checks that catch errors before claims leave the practice.
Rejection Management Workflows
Immediate monitoring and correction of clearinghouse and payer rejections so claims are corrected and resubmitted quickly before delays extend the revenue cycle.
Denial Management SOPs
Standardized procedures for categorizing, tracking, and appealing denied claims within payer timelines.
Revenue Cycle KPI Dashboards
Real-time visibility into key performance indicators like rejection rates, denial rates, days in A/R, and collection ratios.
Diagnostic Questions for Practice Owners
These four operational areas represent the most common fracture points in healthcare revenue cycle management.
Does your practice know...
0 of 8 answered
Do you know your true claim denial rate?
How many claims remain unresolved after 30 days?
How often do claims require resubmission?
What is your revenue per encounter by payer?
Which payer generates the most denials?
What percentage of denials are successfully appealed?
How long does it take to collect on a clean claim?
Are prior authorizations tracked systematically?
Click on each question you can confidently answer with data.
How much revenue is your practice
leaving on the table?
Based on industry benchmarks, this estimate shows what operational gaps in your revenue cycle may be costing you annually.
based on 200 visits/mo at $150 avg reimbursement
Based on your inputs, your practice may be losing this revenue due to inefficiencies across the revenue cycle.
- Eligibility & verification gaps
- Authorization failures
- Claim rejections
- Denials not followed up
- Delays in accounts receivable
See exactly where this revenue is being lost
Get your full breakdown and a prioritized list of where to focus first — sent directly to your inbox.
No spam. This is not a sales pitch — just clarity into your revenue.
Want to see exactly where this is happening in your practice?
Request a Revenue Diagnostic to identify the specific gaps affecting your revenue cycle and how to correct them.
Request My Revenue Diagnostic →The diagnostic is a structured review — not a sales call.
How L&C Helps
L&C Advanced Practice Management works with healthcare practices to identify and resolve operational fractures across their revenue cycle.
Our approach is consultative, not transactional. We focus on understanding the root causes of revenue cycle problems before recommending solutions — because sustainable improvement requires accurate diagnosis.
Structured Revenue Cycle Systems
Operational Clarity
We help practices see exactly where revenue is being lost and why.
Revenue Recovery
Systematic approaches to recovering revenue from denied and underpaid claims.
Workflow Optimization
Streamlining processes to prevent errors before they happen.
Performance Tracking
Ongoing visibility into key revenue cycle metrics and trends.
Long-Term Stability
Building sustainable systems that maintain financial performance over time.
Schedule a Revenue Performance Diagnostic
Unresolved claims
High denial rates
Unpredictable revenue
Payer contract issues
How much revenue is your
practice leaving on the table?
Most practices don’t have a billing problem. They have a systems gap that billing makes visible. This estimator shows you what that gap is likely costing you — in real dollars, every year.
Based on published industry benchmarks. Not a savings pitch — a starting point for an honest conversation.
Industry benchmarks: healthy denial rate <5% · target AR days 30–40 · avg. admin cost per denied claim: $57. Sources: Premier Inc., Experian Health State of Claims 2025, MDaudit 2025.
These numbers are estimates.
The diagnostic finds the real ones.
This estimator uses industry benchmarks to surface the scale of the problem. A Revenue Diagnostic looks at your actual claims data, payer mix, and workflow gaps to find exactly where revenue is leaking — and in what order to address it.
Start a Revenue DiagnosticNot a sales call — no services proposed until we understand your situation.
About these estimates: All figures are calculated using published industry benchmarks from Premier Inc. (2024), Experian Health State of Claims (2025), MDaudit Revenue Integrity Report (2025), and Becker’s Healthcare. The denial revenue leakage calculation assumes a 5% healthy benchmark denial rate and applies your current denial rate against estimated monthly billings. AR float cost represents revenue delayed beyond a 35-day benchmark, calculated against a conservative 6% annualized cost of capital. Denial admin overhead uses the 2023 industry average of $57 per denied claim. These are directional estimates intended to illustrate the scale of potential revenue impact — not a guarantee of recoverable revenue. Actual results will vary based on specialty, payer mix, coding practices, and operational factors specific to your practice.